In this blog post we’re going to use some fundamental Revit and Dynamo skills as well as a builtin Dynamo image processing library to create a workflow that converts an ordinary image into an amazing architectural facade in a matter of minuets (or even seconds depending on your hardware). we’re going to be using curtain walls and custom parametric curtain panels to model this. thus naturally creating the curtain panel family is the first step. after that we’ll learn how to use an image processing library inside of dynamo in order to extract all kinds of useful data from the image file. and last but not least, we’ll use that extracted pixel information to parametrically alter the facade in cool and interesting ways. so without further ado lets get started!
So the first step is to create the parametric curtain panel, the design and geometry for this element are rather simple since we will be placing thousands of these and we really don’t want to push our hardware too far (geometrical detail in the individual family instances is not that important anyways since each instance of this family represents a single pixel which together they create the final impression collectively).
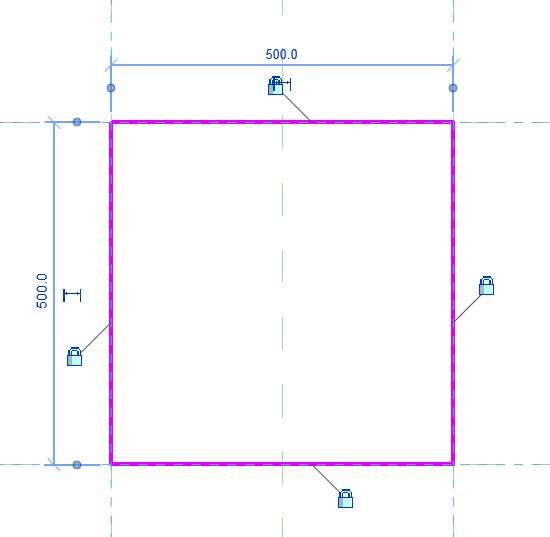
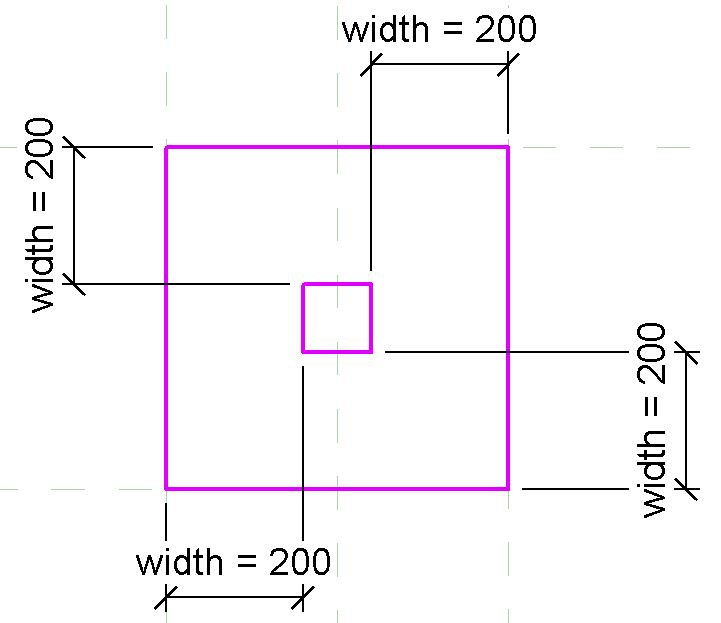
So we’ll start by creating a new family, we will use the template “Metric Curtain Wall Panel”. now we’re good to go… open the exterior view and start by changing the distance between the reference lines (we want to have a 500mm x 500mm panel). once that is done create an extrusion. while in sketch mode, create a rectangular shape and constrain it to the existing reference lines as shown in the image bellow. then draw another rectangle within the first rectangle. we need to constrain this one using an instance parameter. add dimensions to the second rectangle as shown in the second image below, and associate those dimensions with an instance parameter. lets call this parameter “width” for now. once those steps are done, click create form. it’s a good idea to keep the extrusion end at around 100mm.
You could also try and create another 20mm extrusion and constrain it to the inner rectangle to represent the glass but we’ll keep things simple for this demonstration. create a new architectural project and import the new family into it and we’re good to go. now that the custom panel family is complete we can move on to the next step and work on our curtain panel. for this demonstration we’ll be using a 50m x 50m curtain wall with 0.5m x 0.5m panels, effectively giving us 10,000 panels (pardon the unrealistic dimensions, this is for educational purposes only). after selecting our custom panel family as our curtain wall panels, we can move on to dynamo.
An image processing library will allow us to manipulate image files and extract valuable data from them. luckily for us, Dynamo happens to be very flexible in this regard, since it allows us to easily import .Net framework libraries and tools, we can even write custom nodes for Dynamo that use external C# libraries using Zero touch (more on this topic soon). but for the purposes of this tutorial we can use a builtin Dynamo node to extract the pixel data as shown in the graph bellow.
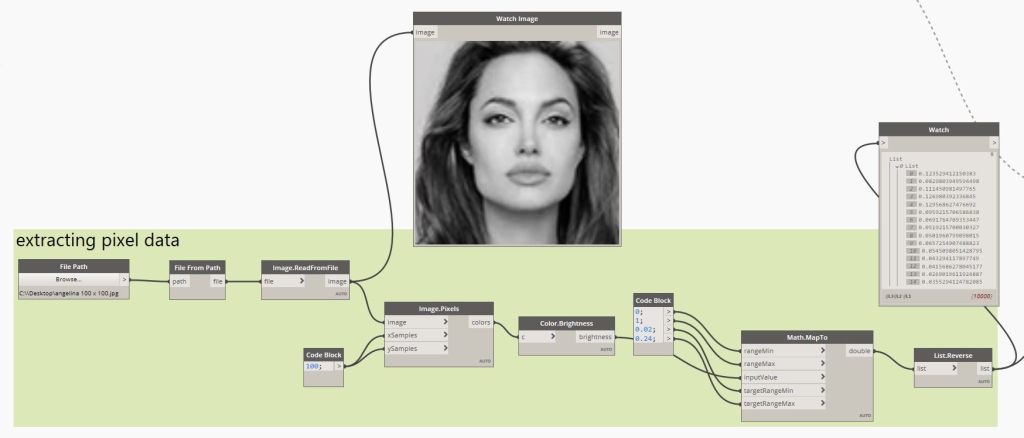
- Get the file path to the image file
- Get file from file path
- Read image from file
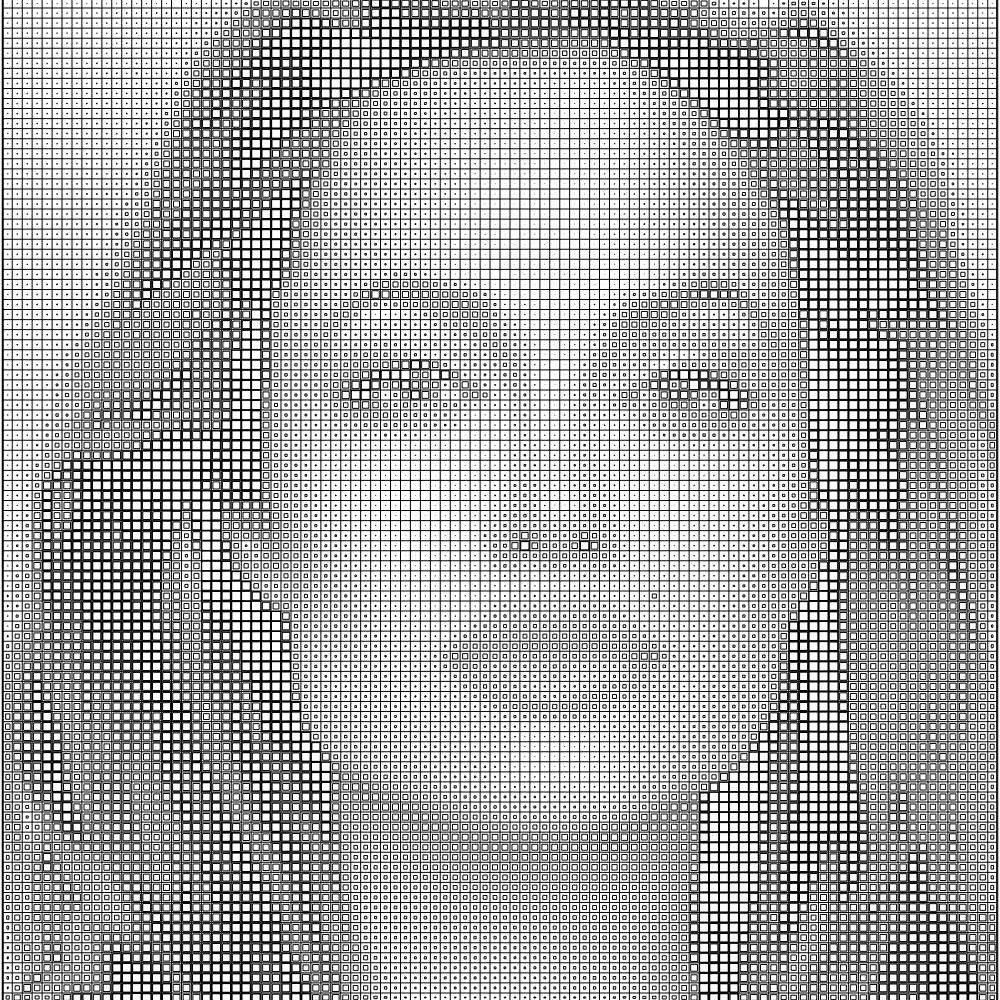
- Get pixel data from image
- Get brightness of each pixel
- Map the values to our panel’s “width” min and max (0.02 and 0.24 in this case).
- Reverse the list
The graph above should be simple enough, I trust that you can easily follow through with it. now that we have extracted pixel brightness values and stored them in a 2 dimensional list (100 lists each containing 100 pixels), we’re ready to move on to the final stage of assigning those values to the relevant panels. selecting all the panels is easy enough but we need some simple list manipulation to get the lists of panels correspond to our data from the image. the following graph does just that.
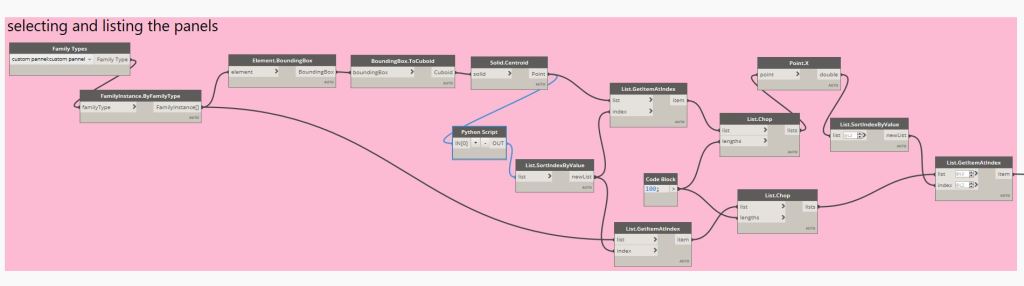
- Selecting the panel family type
- Getting all instances of the family type (10,000)
- Get the bounding box
- Get it’s centroid
- Python code: getting the Z coordinate
- Using “GetItemAtIndex” and “Chop” nodes in conjunction with the Z and X coordinates to sort the panels.
The python code block simply loops through the list of points to get their Z coordinates. of course just like the X coordinate, Z coordinate could also be obtained easily using a builtin dynamo node, but I thought that this was a good opportunity to demonstrate the freedom that the python code block offers us. so using it is completely optional, here’s the code:
# Enable Python support and load DesignScript library
import clr
clr.AddReference('ProtoGeometry')
from Autodesk.DesignScript.Geometry import *

#creating variables to store the lists of points
pts = IN[0]
z = []

#looping through the list of points and getting their Z component
for pt in pts:
    z.append(pt.Z)

#outputing a list of Z components
OUT = z
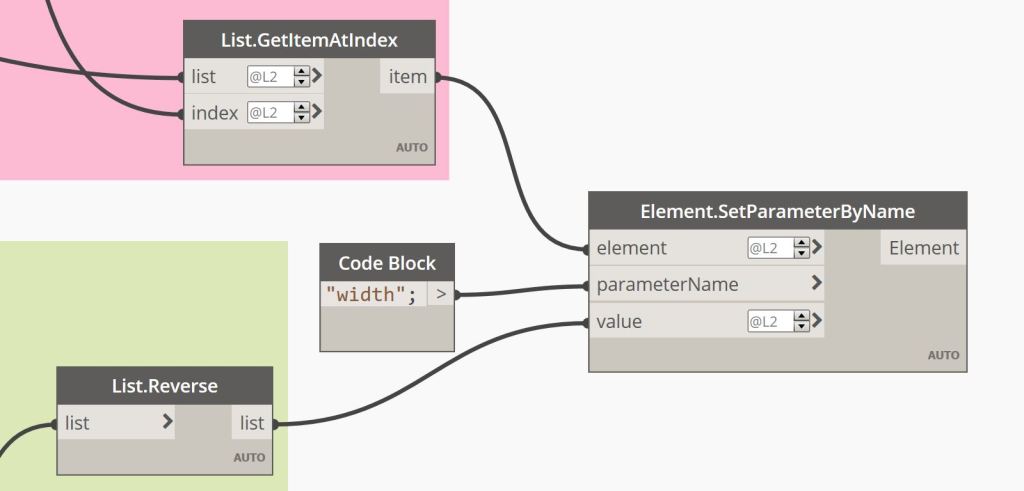
Now all that is left is to assign the values to the panels using a “SetParameterByName” node:
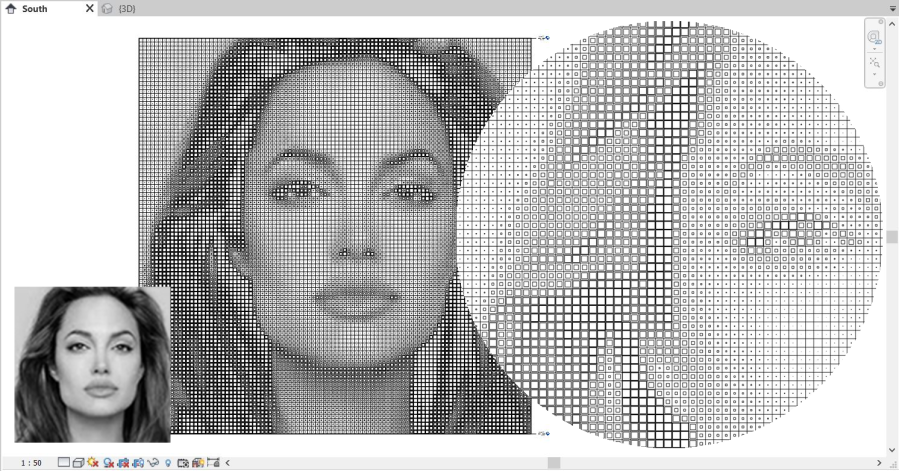
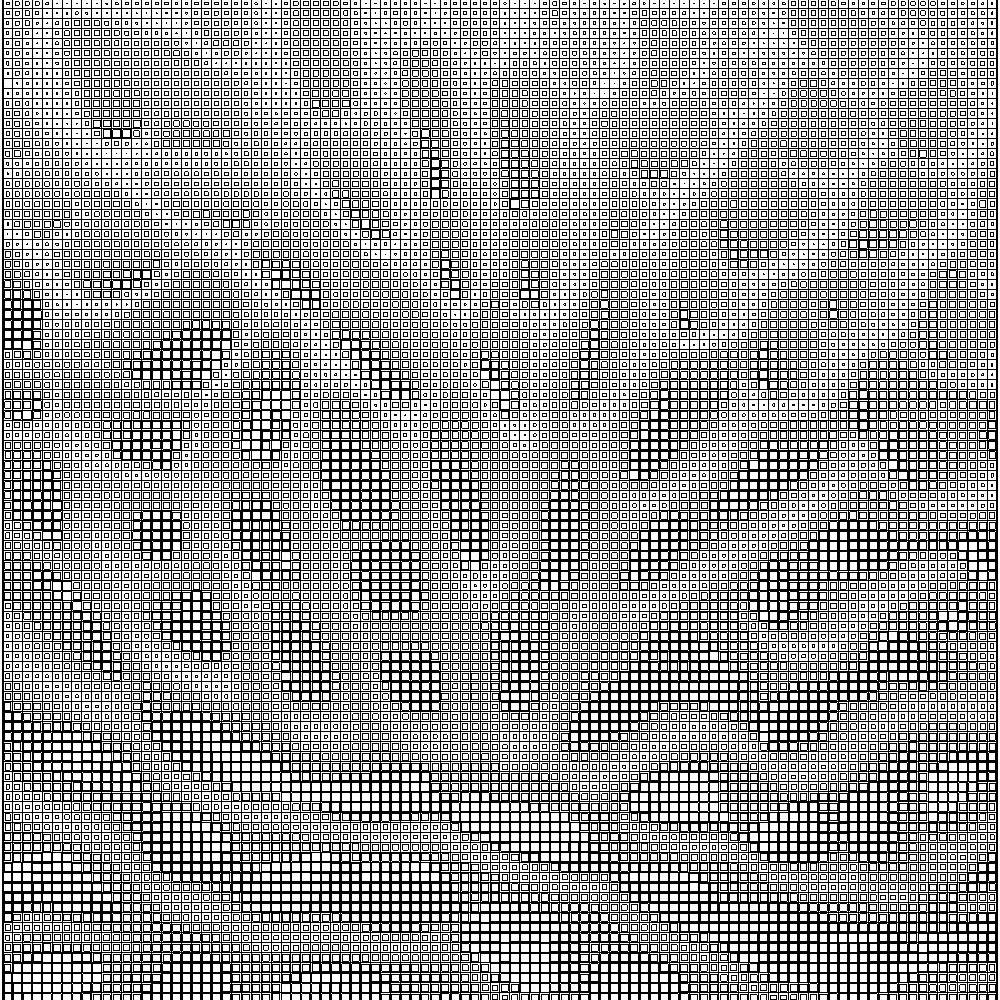
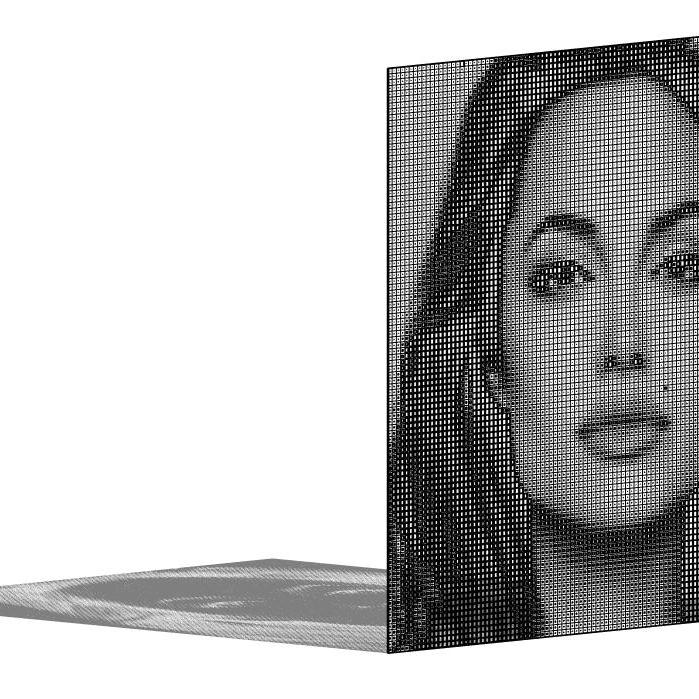
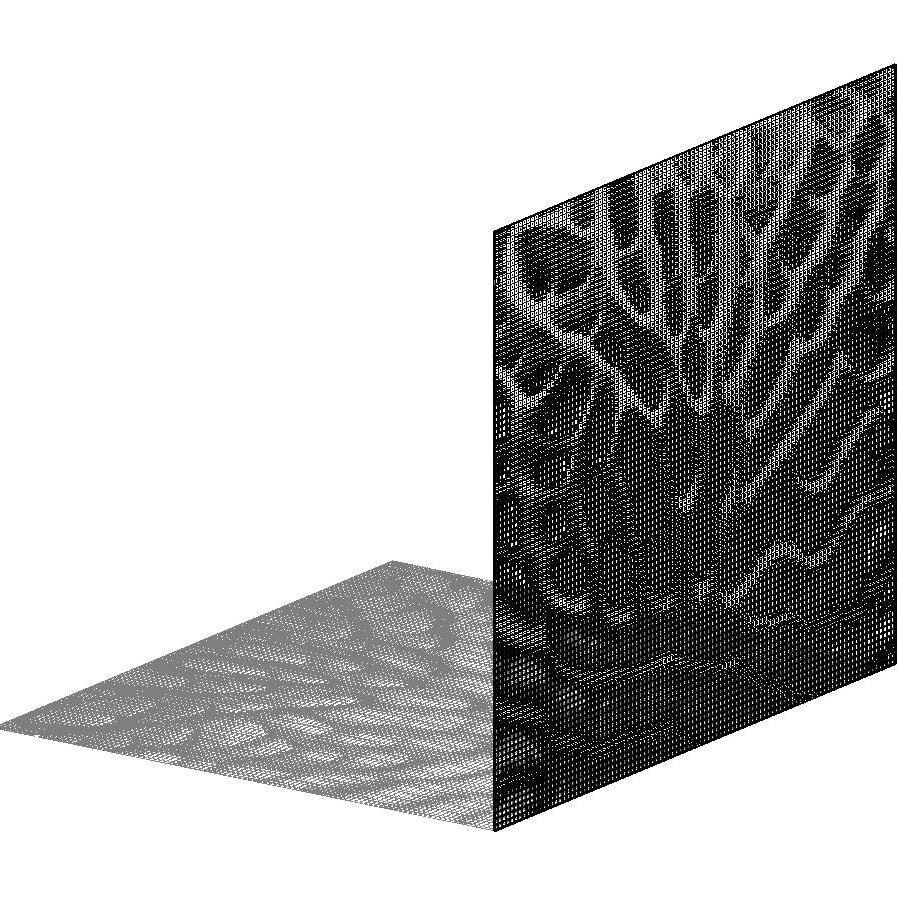
Hit run in dynamo and…. voilà! the facade is complete! I really hope that this tutorial was somewhat useful and that you have enjoyed reading this blog post. keep creating and don’t forget to give something back to the universe!
Done!
The image has been accurately transferred onto our facade!
